Commit 39f115
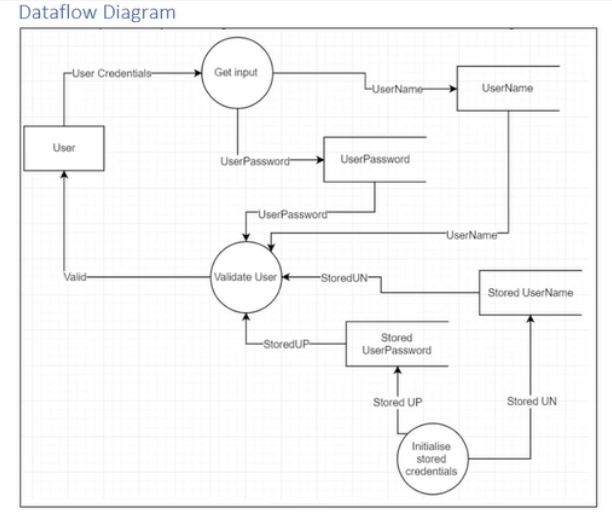
2026-06-08 11:27:12 lisa: C05: remove Connect the Dots; enrich IPO (DFD→IPO) and Pseudocode (maze) pages - Remove page 6 (Connect the Dots) and all links to it (home, IPO, pseudocode, verb-ladder) - IPO page: DFD→IPO framing, two videos (Kalodikis intro + Thill DFD-to-IPO), login-system DFD image, worked Get Input / Initialise Stored Credentials / Validate User IPO tables, Credits - Pseudocode page: 'What is Pseudocode?' video; new maze wall-follower (right-hand rule) worked example with diagram, simulation + EV3 videos, VCAA-syntax pseudocode, why-it-works activity; Credits (Grufo / Wikimedia, GPLv3) Co-Authored-By: Claude Opus 4.8 (1M context) <noreply@anthropic.com>| sd/C05/C05-home.md .. | |
| @@ 21,10 21,6 @@ | |
| - [Design Principles vs UX Characteristics](/sd/C05/Design%20Principles%20vs%20UX%20Characteristics) — why these are two separate lists, why usability appearing in both is a trap, and what the slot-five validation is actually checking | |
| - [The Annotation Verb Ladder](/sd/C05/The%20Annotation%20Verb%20Ladder) — climbing Identify → Describe → Document → Explain so your design-log notes don't stall at "identify" in the no-AI Annotation validation | |
| - | ## C5-3 — Critical & creative thinking |
| - | |
| - | - [Connect the Dots](/sd/C05/Connect%20the%20Dots) — tracing one feature from mood board → mock-up → data dictionary → IPO chart → pseudocode, and linking each design choice to an SRS requirement |
| - | |
| ## Templates and scaffolds | |
| Reusable starting points for C05 deliverables: | |
| sd/C05/Connect the Dots.md .. /dev/null | |
| @@ 1,138 0,0 @@ | |
| - | > **DRAFT** — under teacher review. |
| - | |
| - | # Connect the Dots — Trace One Feature Through Every Layer |
| - | |
| - | The Hamilton and Alexandra College · Year 12 · 2026 |
| - | |
| - | Your designs are not arbitrary choices. Every element you put on a screen should connect back to a real user need in your SRS, and every requirement should trace forward to a concrete implementation. This page shows you how to make that thinking visible — which is exactly what C5-3 Step 2 is testing. |
| - | |
| - | The performance descriptor goes from "outlines connections" (annotations only) up to "documents connections across design ideas, requirements **and** detailed designs." That last level — full traceability — is the 9–10 evidence. |
| - | |
| - | --- |
| - | |
| - | ## 🎬 Watch |
| - | |
| - | > [!NOTE] |
| - | > Video coming soon. |
| - | |
| - | **🎯 Watch for:** how to follow a single design decision all the way from the mood board through to pseudocode, and why stopping at the mock-up is the most common reason students miss the top band. |
| - | |
| - | --- |
| - | |
| - | ## Three Levels of Connection |
| - | |
| - | Work through these in order. Each level adds a layer on top of the last. |
| - | |
| - | ### Level 1 — Annotate Your Designs |
| - | |
| - | Add a written reason to every significant element in your sketches and mock-ups. |
| - | |
| - | A weak annotation describes: *"The button is red."* |
| - | |
| - | A strong annotation justifies: *"Red delete button — follows platform convention and creates a visual stop-sign effect, reducing accidental deletion for non-technical users."* |
| - | |
| - | > [!TIP] |
| - | > The test for a good annotation: can you name the alternative you considered and why you rejected it? If yes, you are justifying. If no, you are only describing. |
| - | |
| - | Examples from a typical SAT project: |
| - | |
| - | - *"Dropdown instead of text field → reduces input errors for non-technical users"* |
| - | - *"Red colour for delete button → follows convention, prevents accidental use"* |
| - | |
| - | ### Level 2 — Link to Your SRS Requirements |
| - | |
| - | Map each design feature back to a requirement using the **same numbering as your SRS** (FR-1, NFR-3, etc.). This is what separates "I thought it looked good" from "this decision was required." |
| - | |
| - | | Design Element | Requirement (SRS ref) | Justification | |
| - | |---|---|---| |
| - | | Search bar on home screen | FR-3: Users can search by name | Fastest path to core feature | |
| - | | Password strength indicator | NFR-2: Security | Guides users without explaining rules | |
| - | | Offline mode indicator | NFR-5: Reliability | Users need to know when data may be stale | |
| - | |
| - | Build this table for your own project using your own SRS numbers. Every significant design decision should appear in it. |
| - | |
| - | ### Level 3 — Trace Through to Detailed Designs |
| - | |
| - | This is the level most students miss. Once you have a design element annotated and linked to the SRS, you need to show that the same decision flows forward into your detailed designs: the data dictionary, the IPO chart, and the pseudocode. |
| - | |
| - | The diagram below shows what that chain looks like for one feature. |
| - | |
| - | ```mermaid |
| - | flowchart TD |
| - | A["🖼️ Mood board<br/>Search icon included<br/>in initial style references"] |
| - | B["📐 Mock-up<br/>Search bar placed top-centre<br/>on home screen (Step 1)"] |
| - | C["📋 SRS link<br/>FR-3: Users can search<br/>by name or category"] |
| - | D["🗄️ Data dictionary<br/>field: search_query<br/>type: String<br/>format: max 100 chars"] |
| - | E["📊 IPO chart<br/>Input: search_query<br/>Process: filter records<br/>Output: filtered list"] |
| - | F["💻 Pseudocode<br/>IF search_query is not empty THEN<br/> results ← filterBy(search_query)<br/>ENDIF"] |
| - | |
| - | A --> B |
| - | B --> C |
| - | C --> D |
| - | D --> E |
| - | E --> F |
| - | ``` |
| - | |
| - | If you can draw this chain for your most important feature, you have Level 3 evidence. |
| - | |
| - | --- |
| - | |
| - | ## The Performance Ladder |
| - | |
| - | | Level | What your evidence looks like | |
| - | |---|---| |
| - | | Basic | Designs exist but no written reasons | |
| - | | Developing | Some annotations, inconsistent | |
| - | | Proficient | Annotations on most elements — outlines connections | |
| - | | Strong | Annotations + SRS table — documents connections to requirements | |
| - | | Excellent | Annotations + SRS table + full trace to detailed designs — 9–10 band | |
| - | |
| - | Stopping at the mock-up is the most common failure mode. A well-annotated, well-linked mock-up with no trace into the data dictionary or pseudocode caps you at the Strong level. Full traceability is what lifts the work into the top band. |
| - | |
| - | --- |
| - | |
| - | ## Common Mistakes |
| - | |
| - | - **Connections implied, not documented** — you know why you made the decision, but you never wrote it down. Markers can only assess what is on the page. |
| - | - **No SRS reference** — annotations explain the choice but never name the requirement it satisfies. The link between design and requirements is missing. |
| - | - **Trace stops at the mock-up** — the design looks connected, but there is no data dictionary entry, no IPO chart, no pseudocode that picks up the same feature. |
| - | - **Wrong SRS numbering** — you use different identifiers in the table than you used in your SRS. Use the exact same labels (FR-3, not "Functional Requirement 3"). |
| - | |
| - | --- |
| - | |
| - | ## Quick Checklist |
| - | |
| - | - [ ] Annotations added to sketches and mock-ups explaining each significant design choice |
| - | - [ ] Each annotation names an alternative and gives a reason (justifies, not just describes) |
| - | - [ ] Each significant design element linked to at least one SRS requirement (FR- or NFR- number) |
| - | - [ ] Traceability table built: Design Element | Requirement (SRS ref) | Justification |
| - | - [ ] At least one feature traced all the way: mood board → mock-up → data dictionary → IPO chart → pseudocode |
| - | - [ ] Connections documented in writing, not just implied |
| - | |
| - | --- |
| - | |
| - | ## Check Your Understanding |
| - | |
| - | 1. A student writes "I used a dropdown menu because it looks cleaner." What is missing from this annotation? |
| - | |
| - | >| **Answer:** The annotation describes a visual preference but does not name an alternative or link to a user need. A stronger version: "Dropdown instead of free-text field → limits input to valid options, reducing input errors for non-technical users (FR-3)." It needs the rejected alternative, the user-facing reason, and the SRS reference. |
| - | |
| - | 2. Your mock-up has a search bar that is fully annotated and linked to FR-3. What additional evidence do you need to reach the top performance band? |
| - | |
| - | >| **Answer:** You need to trace the feature forward into your detailed designs — a data dictionary entry for the search field, an IPO chart showing search as a process, and pseudocode that implements it. Stopping at the mock-up, even a well-annotated one, caps you below the 9–10 band. |
| - | |
| - | 3. Why must the SRS references in your traceability table use the same numbering as your SRS document? |
| - | |
| - | >| **Answer:** The marker needs to verify the link exists. If you write "FR-3" in your traceability table, they can turn to FR-3 in your SRS and confirm the connection. Inconsistent labelling breaks the chain and suggests you have not actually mapped the decisions — it looks like the connections are invented rather than documented. |
| - | |
| - | --- |
| - | |
| - | ## See also |
| - | |
| - | - [Sketch vs Mock-up](/sd/C05/Sketch%20vs%20Mock-up) |
| - | - [Data Dictionary — Format is not Type](/sd/C05/Data%20Dictionary%20-%20Format%20is%20not%20Type) |
| - | - [IPO Charts — Process Means Steps](/sd/C05/IPO%20Charts%20-%20Process%20Means%20Steps) |
| - | - [VCAA Pseudocode — Not Python](/sd/C05/VCAA%20Pseudocode%20Not%20Python) |
| - | - [Plan B Contingency Table](/sd/C05/Plan%20B%20Contingency%20Table) |
| - | |
| - | ← Back to [C05 Home](/sd/C05/C05-home) · [VCE Software Development Hub](/sd/VCE%20Software%20Development%20Hub) |
| sd/C05/IPO Charts - Process Means Steps.md .. | |
| @@ 4,66 4,109 @@ | |
| The Hamilton and Alexandra College · Year 12 · 2026 | |
| - | An IPO chart has three columns — Input, Process, Output — and you write one chart per functional requirement. The chart connects directly to the rest of your design work: your inputs should already appear in your context diagram or DFD, and your Process column should express the same logic as your pseudocode. |
| + | An IPO chart has three columns — **Input**, **Process**, **Output** — and you write one chart per process. The big idea in C05: **your DFD tells you what the charts are.** Every process in your data flow diagram becomes one IPO chart, and the data flowing in and out of it becomes the Input and Output columns. |
| - | The trap that caps students at the 5–6 band is writing the Process column as an outcome instead of as steps. This page shows you exactly what that looks like, and how to fix it. |
| + | The trap that caps students at the 5–6 band is writing the Process column as an *outcome* instead of as *steps*. This page shows what that looks like, how your DFD feeds your charts, and a full worked example. |
| --- | |
| ## The core rule | |
| > [!TIP] | |
| - | > **Process = the steps your algorithm performs.** |
| - | > If your Process cell could also be your Output cell, it is wrong. |
| + | > **Process = the steps that turn input into output.** |
| + | > If your Process cell could just as easily be your Output cell, it is wrong. |
| The three columns do different jobs: | |
| - | - **Input** — the data that enters the functional requirement (trace these from your context diagram / DFD). |
| - | - **Process** — the numbered steps or operations performed on those inputs. Think of it as pseudocode in plain English. |
| - | - **Output** — the result produced after the inputs are processed. |
| + | - **Input** — the data entering the process. Read these straight off your DFD. |
| + | - **Process** — the steps or calculations performed on those inputs: in general terms, *how* the input becomes the output. |
| + | - **Output** — the data the process produces. Also read off your DFD. |
| --- | |
| - | ## Wrong vs Right — the same requirement, two ways |
| + | ## Video 1 — What is an IPO chart? |
| - | The functional requirement below is: *calculate a sales bonus*. |
| + | **🎯 Watch for:** how every row pairs a piece of input with the processing that acts on it — and how the Process column always describes an *action*, never just a result. |
| - | | | Input | Process | Output | |
| - | |---|---|---|---| |
| - | | **WRONG** | Sales amount, Bonus percentage | Calculate the bonus | Bonus amount | |
| - | | **RIGHT** | Sales amount, Bonus percentage | 1. Check if sales amount > 10,000. 2. If true, bonus = sales amount × bonus percentage. 3. If false, bonus = 0. | Bonus amount | |
| + | {{Video|src=https://www.youtube.com/watch?v=a10a11oxjrA}} |
| + | |
| + | > [!NOTE] |
| + | > This video is from an AU teacher pitched at NSW HSC Software Design & Development. The IPO concept is identical to VCE — just note the course name is different. |
| - | Notice what went wrong in the WRONG row: |
| + | ### Check Your Understanding |
| - | - "Calculate the bonus" is just a restatement of the Output. |
| - | - It tells you nothing about *how* the calculation works. |
| - | - A marker cannot award credit for logic that isn't shown. |
| + | A login screen has an IPO chart. For each item, decide which column it belongs in — **Input**, **Process**, or **Output**: |
| - | The RIGHT row shows the decision and the two branches. That is what earns marks in the upper bands. |
| + | 1. The username and password typed in by the user. |
| + | >| **Input** — data entering the process. |
| + | |
| + | 2. Compare the entered password with the stored password and set a valid/invalid flag. |
| + | >| **Process** — a step performed on the input. |
| + | |
| + | 3. An "Access granted" or "Access denied" message on the screen. |
| + | >| **Output** — the result the process produces. |
| --- | |
| - | ## How the three columns connect to your other design work |
| + | ## The big idea: from DFD to IPO |
| + | |
| + | Your data flow diagram already did the hard part. **Each process in the DFD becomes its own IPO chart:** |
| + | |
| + | - the **arrows flowing in** → the Input column |
| + | - the **process** itself → the Process column (the steps) |
| + | - the **arrows flowing out** → the Output column |
| + | |
| + | **🎯 Watch for:** how a single process from a DFD is turned into one IPO chart, with the data flows becoming the Input and Output rows. |
| + | |
| + | {{Video|src=https://www.youtube.com/watch?v=YMOP0GlWXOY}} |
| + | |
| + | Here is a DFD for a simple login system: |
| + | |
| + |  |
| + | |
| + | Each process in that diagram becomes one IPO chart. Start with the general shape: |
| + | |
| + | ### (template) Name of the process |
| - | ```mermaid |
| - | flowchart LR |
| - | CD["Context diagram / DFD<br/>(identifies data flows)"] |
| - | IPO["IPO chart<br/>(Input · Process · Output)"] |
| - | PS["Pseudocode<br/>(same logic, formal syntax)"] |
| - | CD -->|"inputs come from here"| IPO |
| - | IPO -->|"process mirrors this"| PS |
| - | ``` |
| + | | Input | Process | Output | |
| + | | :--- | :--- | :--- | |
| + | | List the inputs as per the DFD | Explain, in general terms, how the processing/calculations convert the input to the output | List the outputs as per the DFD | |
| - | Your Process column and your pseudocode should describe the same algorithm. If they contradict each other, one of them is wrong — check both. |
| + | Now the three real processes from the DFD above. |
| + | |
| + | ### DFD process: Get Input |
| + | |
| + | | Input | Process | Output | |
| + | | :--- | :--- | :--- | |
| + | | Two separate strings keyed in by the user. | Prompt the user for their username, then store the response in the `UserName` variable.<br><br>Prompt the user for their password, then store the response in the `UserPassword` variable. | Entered string written to `UserName`.<br><br>Entered string written to `UserPassword`. | |
| + | |
| + | ### DFD process: Initialise Stored Credentials |
| + | |
| + | | Input | Process | Output | |
| + | | :--- | :--- | :--- | |
| + | | *(none — the values are hardcoded)* | Write the hardcoded value into the `StoredUN` variable.<br><br>Write the hardcoded value into the `StoredPW` variable. | `StoredUN`<br><br>`StoredPW` | |
| + | |
| + | ### DFD process: Validate User |
| + | |
| + | | Input | Process | Output | |
| + | | :--- | :--- | :--- | |
| + | | `UserName`<br><br>`StoredUN`<br><br>`UserPassword`<br><br>`StoredPW` | Set a `bValid` boolean to False.<br><br>Compare `UserName` with `StoredUN`.<br><br>IF `UserName` = `StoredUN` THEN compare `UserPassword` with `StoredPW`.<br><br>IF those ALSO match THEN set `bValid` to True. | `bValid` | |
| + | |
| + | The Process column for *Validate User* lists the actual decision steps — not just "check the login". **That** is what scores in the upper bands. |
| --- | |
| - | ## 🎬 Watch |
| + | ## Wrong vs Right |
| - | > [!NOTE] |
| - | > Video coming soon. |
| + | The same process, written two ways: |
| + | |
| + | | | Input | Process | Output | |
| + | |---|---|---|---| |
| + | | **❌ Wrong** | `UserName`, `StoredUN`, `UserPassword`, `StoredPW` | Check the login | `bValid` | |
| + | | **✅ Right** | `UserName`, `StoredUN`, `UserPassword`, `StoredPW` | 1. Set `bValid` = False. 2. Compare `UserName` with `StoredUN`. 3. If equal, compare `UserPassword` with `StoredPW`. 4. If both match, set `bValid` = True. | `bValid` | |
| - | **🎯 Watch for:** how a complete Process column maps directly onto a pseudocode IF–THEN–ELSE structure, making it obvious that the Process column is algorithm steps, not a label for the Output. |
| + | - "Check the login" just restates the goal — it shows none of the logic. |
| + | - The Right version shows each comparison and decision. A marker can only credit logic that is visible. |
| --- | |
| @@ 71,46 114,48 @@ | |
| ### Mistake 1: Process that copies the Output | |
| - | > ~~"Work out the bonus amount."~~ |
| + | > ~~"Work out whether the login is valid."~~ |
| - | This is just the Output column repeated. Replace it with the numbered decision steps. |
| + | That is the Output column repeated. Replace it with the numbered decision steps. |
| ### Mistake 2: Missing the decision branches | |
| - | > ~~"1. Calculate bonus using sales × bonus percentage."~~ |
| + | > ~~"Compare the username and password."~~ |
| - | This ignores the condition. If there is a threshold or an IF in the logic, both branches must appear in the Process column. |
| + | If there is an IF in the logic, the steps must show what happens on each branch — set the flag True only when *both* match. |
| - | ### Mistake 3: Inputs not traced to diagrams |
| + | ### Mistake 3: Inputs not traced to the DFD |
| - | Your inputs should be data flows you have already documented in a context diagram or DFD. If an input appears in your IPO chart but nowhere in your diagrams, that is a consistency problem the marker will notice. |
| + | Every input in an IPO chart should be a data flow you already drew in your DFD. An input that appears from nowhere is a consistency error the marker will notice. |
| ### Mistake 4: One IPO chart for everything | |
| - | Write one chart per functional requirement. Each requirement has its own inputs, its own logic and its own output — cramming multiple requirements into one chart makes the Process column vague by design. |
| + | Write one chart per process. Each DFD process has its own inputs, logic and outputs — cramming them together makes the Process column vague by design. |
| --- | |
| ## Check Your Understanding | |
| - | 1. A student writes Process = "display the total price". What is wrong with this, and how should they fix it? |
| + | 1. Where do the Input and Output columns of an IPO chart come from? |
| + | |
| + | >| From your **DFD** — the data flowing into a process becomes the Input column, and the data flowing out becomes the Output column. The IPO chart details the process in between. |
| - | >| **Answer:** "Display the total price" is an outcome — it names the output, not the steps. The student should replace it with numbered operations: e.g. 1. Retrieve unit price and quantity. 2. Multiply unit price × quantity to get subtotal. 3. Add GST (subtotal × 0.10). 4. Display the result. The Process column must show the *how*, not the *what*. |
| + | 2. A student writes Process = "display the total price". What is wrong, and how should they fix it? |
| - | 2. Where should the inputs listed in your IPO chart already appear in your design documentation? |
| + | >| "Display the total price" names the output, not the steps. Replace it with the operations: e.g. 1. Retrieve unit price and quantity. 2. Multiply them for the subtotal. 3. Add GST. 4. Display the result. The Process column must show the *how*. |
| - | >| **Answer:** In your context diagram or data flow diagram. Inputs are data flows entering the system or a process — they should already be named and labelled in those diagrams. If an input appears in the IPO chart but not in any diagram, there is a consistency error to fix. |
| + | --- |
| - | 3. You have a functional requirement with a condition: "if the score is 50 or above, the student passes; otherwise they fail." How many branches should appear in your Process column? |
| + | ## Credits |
| - | >| **Answer:** Two branches. 1. Check if score ≥ 50. 2. If true, result = "Pass". 3. If false, result = "Fail". Both outcomes of the condition must be shown — leaving out the false branch means the algorithm is incomplete. |
| + | - Login-system DFD — supplied for The Hamilton and Alexandra College SD course. |
| --- | |
| ## See also | |
| - | - [VCAA Pseudocode — Not Python](/sd/C05/VCAA%20Pseudocode%20Not%20Python) |
| + | - [VCAA Pseudocode — Not Python](/sd/C05/VCAA%20Pseudocode%20Not%20Python) — turn each IPO Process column into formal pseudocode |
| - [Data Dictionary — Format is not Type](/sd/C05/Data%20Dictionary%20-%20Format%20is%20not%20Type) | |
| - | - [Connect the Dots](/sd/C05/Connect%20the%20Dots) |
| + | - [Sketch vs Mock-up](/sd/C05/Sketch%20vs%20Mock-up) |
| ← Back to [C05 Home](/sd/C05/C05-home) · [VCE Software Development Hub](/sd/VCE%20Software%20Development%20Hub) | |
| /dev/null .. sd/C05/IPO Charts - Process Means Steps/DFD-for-IPO.png | |
| sd/C05/The Annotation Verb Ladder.md .. | |
| @@ 126,7 126,6 @@ | |
| ## See also | |
| - [Design Principles vs UX Characteristics](/sd/C05/Design%20Principles%20vs%20UX%20Characteristics) | |
| - | - [Connect the Dots](/sd/C05/Connect%20the%20Dots) |
| - [C05 Resources](/sd/Resources/C05-Resources) | |
| --- | |
| sd/C05/VCAA Pseudocode Not Python.md .. | |
| @@ 8,12 8,13 @@ | |
| --- | |
| - | ## 🎬 Watch |
| + | ## 🎬 What is pseudocode? |
| - | > [!NOTE] |
| - | > Video coming soon. |
| + | **🎯 Watch for:** the core idea — pseudocode describes *what the algorithm does* in plain, structured steps, without committing to any one programming language. |
| + | |
| + | {{Video|src=https://www.youtube.com/watch?v=wKe31Xi2Ck8}} |
| - | **🎯 Watch for:** how to translate a working Python method into clean VCAA pseudocode, keeping the logic identical while swapping Python syntax for language-independent Structured English. |
| + | **✍️ While you watch:** write down the one sentence that best explains *why* we bother with pseudocode instead of going straight to code. |
| --- | |
| @@ 73,7 74,7 @@ | |
| --- | |
| - | ## Worked example — a method inside a class |
| + | ## Worked example 1 — a method inside a class |
| This is the Level-9 OOP pseudocode skill. You are writing a method, not a standalone program, so you use `BEGIN`/`END` rather than `START`/`STOP`. | |
| @@ 106,6 107,59 @@ | |
| --- | |
| + | ## Worked example 2 — one algorithm, any machine |
| + | |
| + | Pseudocode's superpower is that it is **language- and machine-independent**. Here is a complete algorithm — the **wall-follower**, or *right-hand rule*, for escaping a maze — written once and able to run anywhere: in your head, in a software simulation, or on a Lego robot. |
| + | |
| + | The rule is simple: **keep your right hand on the wall and never lift it.** In any maze whose walls are all connected, following it will always bring you to the exit. |
| + | |
| + |  |
| + | |
| + | *Trace it yourself: start at the top-left entrance and keep your right hand on the wall. Where do you come out? (Background reading: [Wikipedia — Maze-solving algorithm](https://en.wikipedia.org/wiki/Maze-solving_algorithm).)* |
| + | |
| + | The same idea in VCAA pseudocode: |
| + | |
| + | ``` |
| + | START at the maze entrance |
| + | |
| + | WHILE not at the exit DO |
| + | IF the right-hand side is open THEN |
| + | // an opening — follow the wall around the corner |
| + | turn right |
| + | step forward |
| + | ELSE IF the way ahead is clear THEN |
| + | // keep moving, right hand sliding along the wall |
| + | step forward |
| + | ELSE IF only the left is open THEN |
| + | // wall ahead and on the right |
| + | turn left |
| + | step forward |
| + | ELSE |
| + | // dead end — walls on three sides |
| + | turn around |
| + | ENDIF |
| + | ENDWHILE |
| + | |
| + | OUTPUT "Hooray! I escaped the maze!" |
| + | ``` |
| + | |
| + | There is no Python and no Java here — nothing tied to one language. That is exactly what makes it pseudocode. |
| + | |
| + | Now watch the *same rule* run on two completely different machines: |
| + | |
| + | **🎯 Watch for:** the right-hand rule as a software simulation — the logic is identical to the pseudocode above. |
| + | |
| + | {{Video|src=https://www.youtube.com/watch?v=mFOSd44_NfA}} |
| + | |
| + | **🎯 Watch for:** the very same rule driving a physical Lego EV3 robot through a real maze — same algorithm, different machine. |
| + | |
| + | {{Video|src=https://www.youtube.com/watch?v=AdOLnKFzBoM}} |
| + | |
| + | > [!NOTE] |
| + | > **Activity — why does the right-hand rule work?** Write two or three sentences. Hint: picture a wall that is connected to the outer boundary of the maze. If you trace its edge without ever letting go, can you ever get stuck in a loop — or must you eventually walk the whole of that wall, including the stretch that contains the exit? |
| + | |
| + | --- |
| + | |
| ## Common mistakes | |
| ### Mistake 1 — Using `=` or `==` for assignment | |
| @@ 154,10 208,15 @@ | |
| --- | |
| + | ## Credits |
| + | |
| + | - Maze diagram — [Grufo](https://commons.wikimedia.org/wiki/User:Grufo), via Wikimedia Commons, licensed GPLv3. |
| + | |
| + | --- |
| + | |
| ## See also | |
| - | - [IPO Charts — Process Means Steps](/sd/C05/IPO%20Charts%20-%20Process%20Means%20Steps) |
| - | - [Connect the Dots](/sd/C05/Connect%20the%20Dots) |
| + | - [IPO Charts — Process Means Steps](/sd/C05/IPO%20Charts%20-%20Process%20Means%20Steps) — turn an IPO Process column into formal pseudocode |
| - [C05 Resources](/sd/Resources/C05-Resources) | |
| --- | |
| /dev/null .. sd/C05/VCAA Pseudocode Not Python/maze-right-hand-rule.png | |