
Godot Debugging Tools — GDScript
The 90-second tour of what Godot gives you for debugging. For the hands-on breakpoint workflow, see Debugging with Breakpoints in Godot.
Definition. Debugging is finding and fixing the errors in your program: syntax errors (won't run), logic errors (runs, but the result is wrong) and run-time errors (crashes while running). The C8-1 rubric looks for debugging statements at level 3–4 and breakpoints at level 5–6 — used on your own project, not described in the abstract.
Print debugging — the "debugging statements"
Everything prints to the Output panel at the bottom of the editor.
print("DEBUG: score = ", score)        # always prints
print_debug("reached lock_piece()")    # adds the script and line number
push_warning("shape bag is empty")     # yellow warning in the Debugger's Errors tab
push_error("negative score!")          # red error in the Errors tab (does not stop the game)
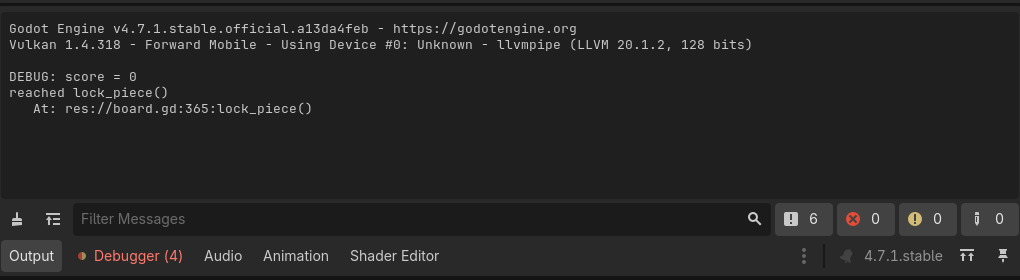
A debugging statement earns its keep when it answers a question: what value does this variable hold? did this line run at all? in what order? Comment it out once answered — the added-then-removed print in your git history is itself debugging evidence.
The Debugger panel
Opens at the bottom when your game hits a breakpoint or crashes on an error. Here is the whole editor at the moment a breakpoint pauses the game — the yellow arrow marks the paused line, and the Debugger panel takes over the bottom:
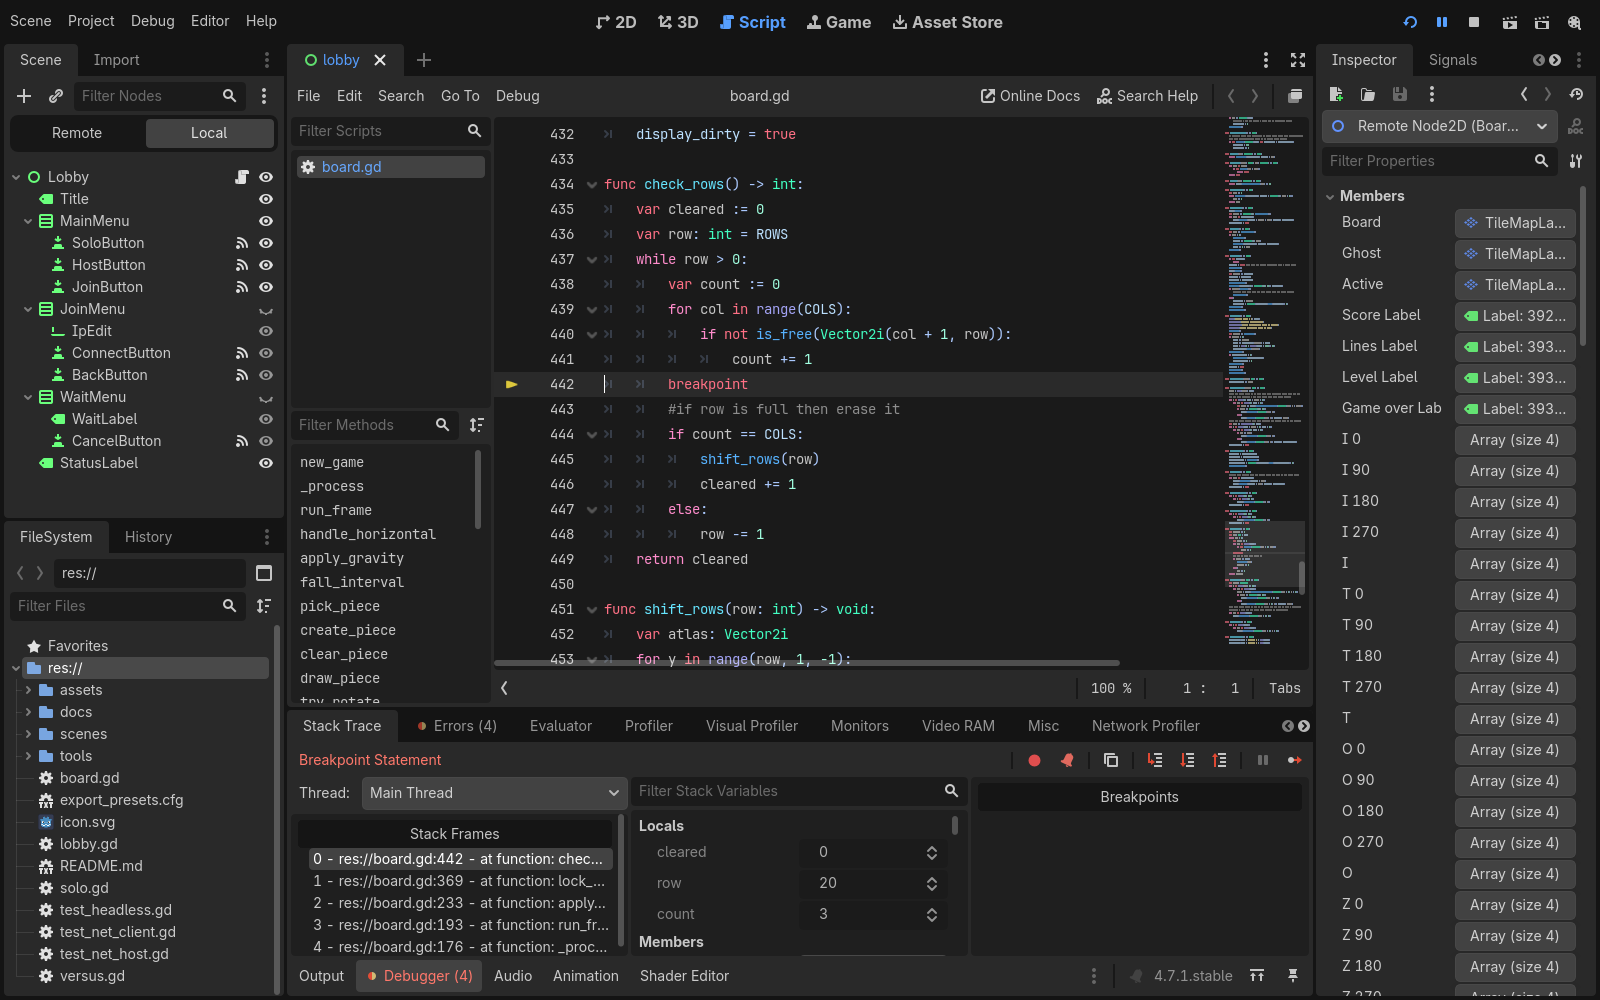
| Where to look | What it shows |
|---|---|
| Stack Trace / Stack Frames | which function called which — where you are and how execution got there |
| Locals | every variable in the current function and its value right now |
| Breakpoints | every red dot in your project — jump to, disable or delete them |
| Errors | run-time errors and warnings, with clickable locations |
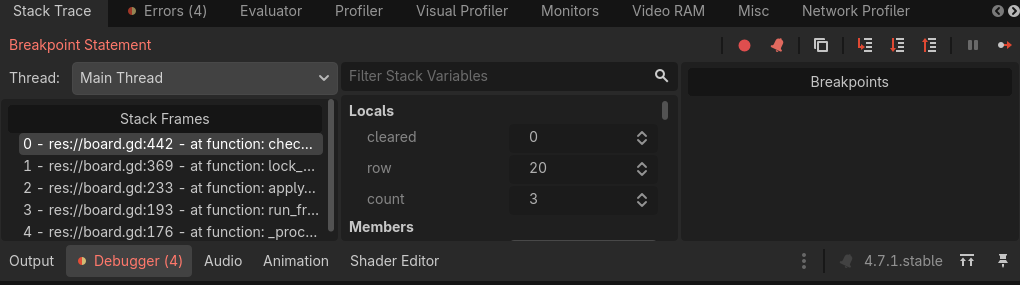
A close-up of the panel while paused — Stack Frames on the left (check_rows was called by lock_piece, and so on up the chain), Locals on the right showing cleared, row and count at this exact moment:
Breakpoints
Click in the gutter left of a line number — a red dot appears. Run the scene; the game pauses on that line and the Debugger opens, with Continue, Step Over and Step Into buttons. Breakpoints survive editor restarts, and the breakpoint keyword in GDScript sets one from code. Full workflow: Debugging with Breakpoints in Godot.
Two more worth knowing
- Remote scene tree — while the game runs, the Scene dock gains a Remote tab showing the live node tree; click any node to inspect (and even edit) its properties in real time.
- Debug menu (top of the editor) — Visible Collision Shapes draws your collision shapes in the running game; Synchronize Script Changes hot-reloads script edits without restarting.
Watch
Debugging Tips You MUST Know as a Godot Developer (DevWorm, 5:27) — https://www.youtube.com/watch?v=PB6YPnRAyjE — advanced print statements at 02:23, breakpoints at 03:15.
Full detail: Overview of debugging tools — official Godot docs