Commit 4d4b35
2026-08-18 12:53:37 lisa: C08: add Debugging with Tetris practice page and real editor screenshots Generated from C08-Reference-Godot via the port script. Three seeded-bug practice branches on jeremy-oz/godot-tetris; Godot Debugging Tools now shows the Output panel, a paused breakpoint, and the Locals close-up. Co-Authored-By: Claude Fable 5 <noreply@anthropic.com> Claude-Session: https://claude.ai/code/session_01Sby5b7atWGmZBLBRz9Mynb| sd/C08/C08-home.md .. | |
| @@ 20,6 20,7 @@ | |
| - [Godot Debugging Tools](/sd/C08/Godot%20Debugging%20Tools) — the 90-second tour: Output panel, Debugger panel, and what each is for | |
| - [Debugging with Breakpoints in Godot](/sd/C08/Debugging%20with%20Breakpoints%20in%20Godot) — set, step, inspect: the hands-on workflow | |
| + | - [Debugging with Tetris](/sd/C08/Debugging%20with%20Tetris) — three seeded bugs in a real game: practise statements, breakpoints, then the full test-and-rectify cycle |
| **Alpha testing (C8-1)** | |
| /dev/null .. sd/C08/Debugging with Tetris.md | |
| @@ 0,0 1,36 @@ | |
| + | <!-- Generated from applied-computing-au vic/unit3-4/sat/C08-2026/C08-Reference-Godot by port-reference-godot-to-wiki.py — do not hand-edit; re-run the port. --> |
| + | # Debugging with Tetris — three practice bugs |
| + | |
| + | *Practise the C8-1 skills on a real Godot game before you use them on your own SAT project. Each exercise is a git branch with a seeded fault and a brief; the tools are covered in [Godot Debugging Tools](/sd/C08/Godot%20Debugging%20Tools) and [Debugging with Breakpoints in Godot](/sd/C08/Debugging%20with%20Breakpoints%20in%20Godot).* |
| + | |
| + | ## Setup (once) |
| + | |
| + | ``` |
| + | git clone https://github.com/jeremy-oz/godot-tetris |
| + | ``` |
| + | |
| + | Open the folder in **Godot 4.7**. Controls: arrows move, **Z / X** rotate, **Down** soft drop, **Space** hard drop, **C** hold. |
| + | |
| + | For each exercise: `git checkout <branch>`, then read **`C8-DEBUG-EXERCISE.md`** at the repo root — the brief changes with the branch. |
| + | |
| + | ## The three exercises |
| + | |
| + | | Branch | The story | Skill you practise | Rubric | |
| + | |---|---|---|---| |
| + | | `c8-debug-statements` | The score creeps up on its own — which line adds the phantom points? | **Debugging statements** — `print_debug` at each suspect site, read the Output panel | 3–4 | |
| + | | `c8-debug-breakpoint` | The new Perfect Clear bonus never pays. | **Breakpoints** — pause the decision, Step Into, read the Locals panel | 5–6 | |
| + | | `c8-debug-rectify` | The new IP validation lets rubbish through. | **The full cycle** — run a testing table, debug the failing rows, rectify, re-run, document corrective actions | 5–10 | |
| + | |
| + | Do them in order — each exercise assumes the tool from the one before. |
| + | |
| + | ## The loop these exercises teach |
| + | |
| + | Your [testing table](/sd/C08/Testing%20Tables%20and%20Corrections) and the debugger are one workflow, not two documents: |
| + | |
| + | **the table finds the failure → the debugger locates the fault → the Corrective Action column records what the debugger showed you → the re-run turns the row green.** |
| + | |
| + | Exercise 3 ends with a **narrated practice recording** of that loop — the same unbroken fix cycle your real C8-1 screen recording must show. |
| + | |
| + | > **Practice is not evidence.** Your C8-1 recording must show your **own SAT project** — your git log, your testing table, your code. A tetris recording earns exactly zero rubric levels; it just makes the real one easy. |
| + | |
| + | When a branch has beaten you (that's allowed): `git diff main` shows the seeded change. Look only after you've genuinely tried the tool — the diff answers *where*, but the exercise was *how to find where*. |
| sd/C08/Godot Debugging Tools.md .. | |
| @@ 10,17 10,21 @@ | |
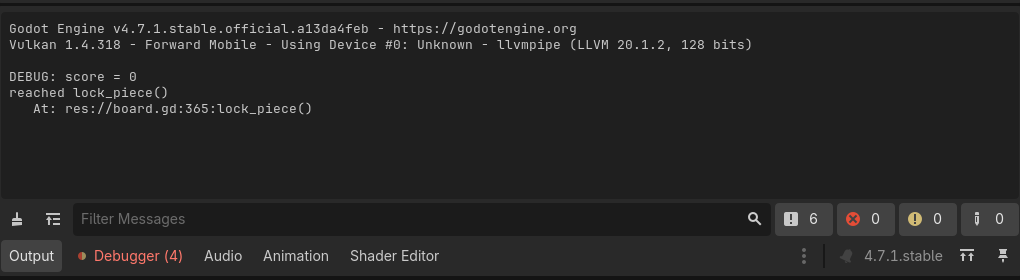
| Everything prints to the **Output** panel at the bottom of the editor. | |
| ```gdscript | |
| - | print("DEBUG: balance = ", balance) # always prints |
| - | print_debug("reached _apply_fare()") # adds the script and line number |
| - | push_warning("fare table is empty") # yellow warning in the Debugger |
| - | push_error("negative balance!") # red error in the Debugger (does not stop the game) |
| + | print("DEBUG: score = ", score) # always prints |
| + | print_debug("reached lock_piece()") # adds the script and line number |
| + | push_warning("shape bag is empty") # yellow warning in the Debugger's Errors tab |
| + | push_error("negative score!") # red error in the Errors tab (does not stop the game) |
| ``` | |
| + |  |
| + | |
| A debugging statement earns its keep when it answers a question: *what value does this variable hold? did this line run at all? in what order?* Comment it out once answered — the added-then-removed print in your git history is itself debugging evidence. | |
| ## The Debugger panel | |
| - | Opens at the bottom when your game hits a breakpoint or crashes on an error. |
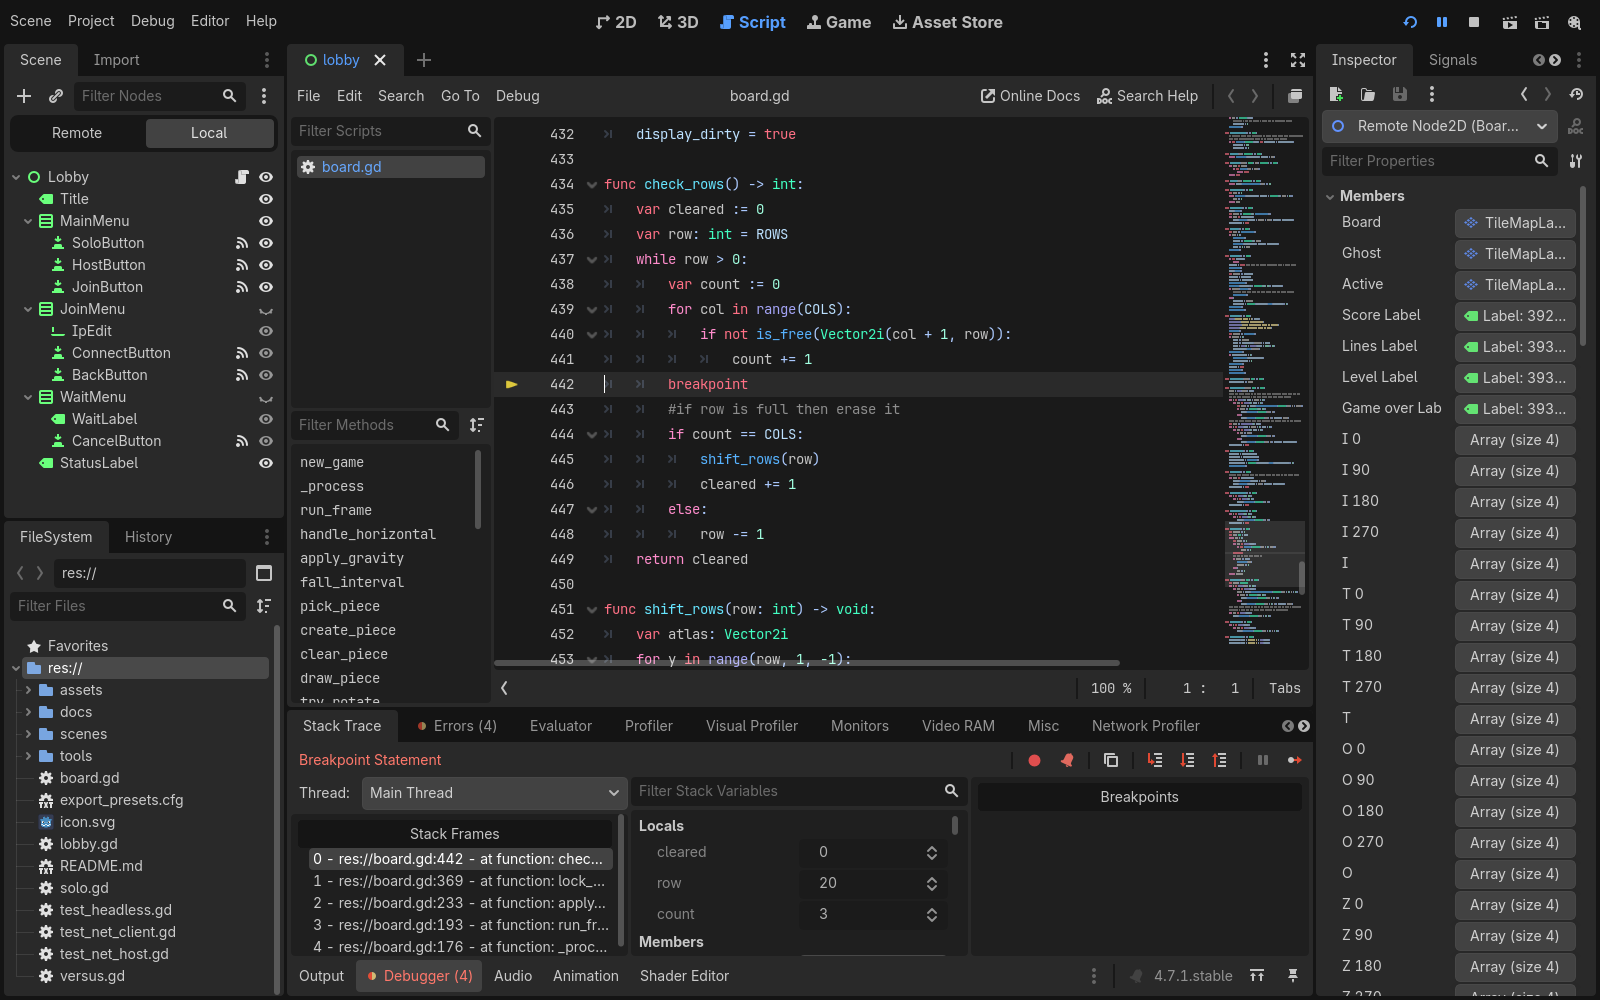
| + | Opens at the bottom when your game hits a breakpoint or crashes on an error. Here is the whole editor at the moment a breakpoint pauses the game — the yellow arrow marks the paused line, and the Debugger panel takes over the bottom: |
| + | |
| + |  |
| | Where to look | What it shows | | |
| |---|---| | |
| @@ 29,6 33,10 @@ | |
| | **Breakpoints** | every red dot in your project — jump to, disable or delete them | | |
| | **Errors** | run-time errors and warnings, with clickable locations | | |
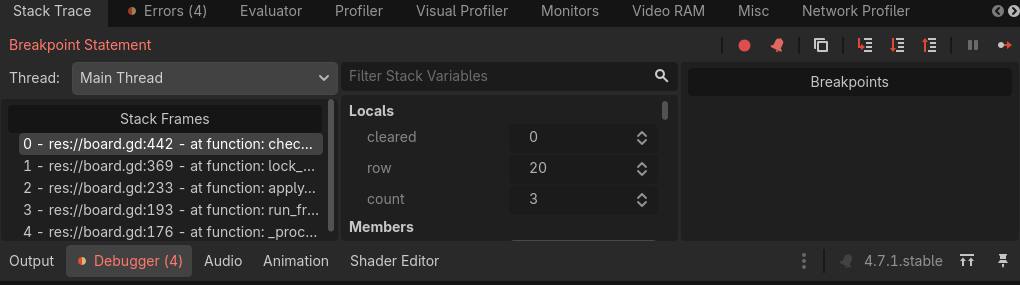
| + | A close-up of the panel while paused — Stack Frames on the left (`check_rows` was called by `lock_piece`, and so on up the chain), Locals on the right showing `cleared`, `row` and `count` at this exact moment: |
| + | |
| + |  |
| + | |
| ## Breakpoints | |
| Click in the gutter left of a line number — a red dot appears. Run the scene; the game pauses on that line and the Debugger opens, with **Continue**, **Step Over** and **Step Into** buttons. Breakpoints survive editor restarts, and the `breakpoint` keyword in GDScript sets one from code. Full workflow: [Debugging with Breakpoints in Godot](/sd/C08/Debugging%20with%20Breakpoints%20in%20Godot). | |
| /dev/null .. sd/C08/Godot Debugging Tools/godot_debugger_locals.png | |
| /dev/null .. sd/C08/Godot Debugging Tools/godot_debugger_paused.png | |
| /dev/null .. sd/C08/Godot Debugging Tools/godot_output_panel.png | |