Commit 5eef4a
2026-06-11 08:14:51 lisa: Tool 2: add Student + CriterionGrade class boxes; pre-render class diagrams to PNG OtterWiki's bundled mermaid renders classDiagram poorly, so both diagrams are now rendered locally with mermaid-cli 11 and embedded as images. Co-Authored-By: Claude Fable 5 <noreply@anthropic.com>| sd/C05/From SRS to Detailed Designs - Data and Logic.md .. | |
| @@ 106,6 106,12 @@ | |
| > **Stored vs derived, as attribute vs method** — `final` is an attribute (a teacher's decision, stored); `calculated()` is a method (a weighted average, derived). This is the class-diagram form of our data rule "derived values are never stored". | |
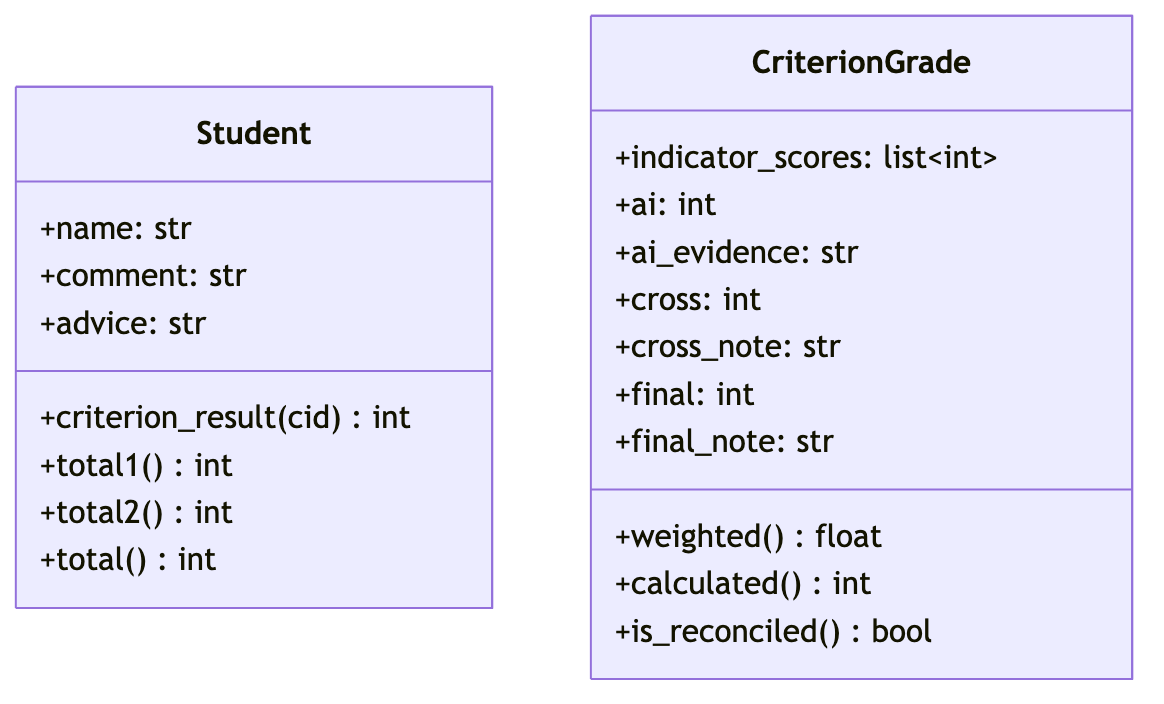
| + | Here are the two classes you have already met in the data dictionary — `Student` and `CriterionGrade` — with the relationships left out so you can concentrate on reading each box: |
| + | |
| + |  |
| + | |
| + | Read each box top to bottom: the upper compartment is the **attributes** — everything stored, and every one of them is a row you saw in the data dictionary's student record (`indicator_scores`, `ai`, `cross`, `final`, …). The lower compartment is the **methods** — everything derived, and every one of them is a row from the data dictionary's §5 (`calculated`, the totals behind the leaderboard). The horizontal line between the compartments *is* the stored/derived split, drawn in UML. |
| + | |
| So the data dictionary's "stored vs derived" split is the object model's "attribute vs method" split. `final` carries `()` nowhere — it is a value you keep. `calculated()` carries `()` — it is a value you *compute on demand* and throw away. | |
| ### Tool 3 — Pseudocode: how the derived value is actually computed | |
| @@ 210,76 216,9 @@ | |
| ### Object descriptions ← the problem domain | |
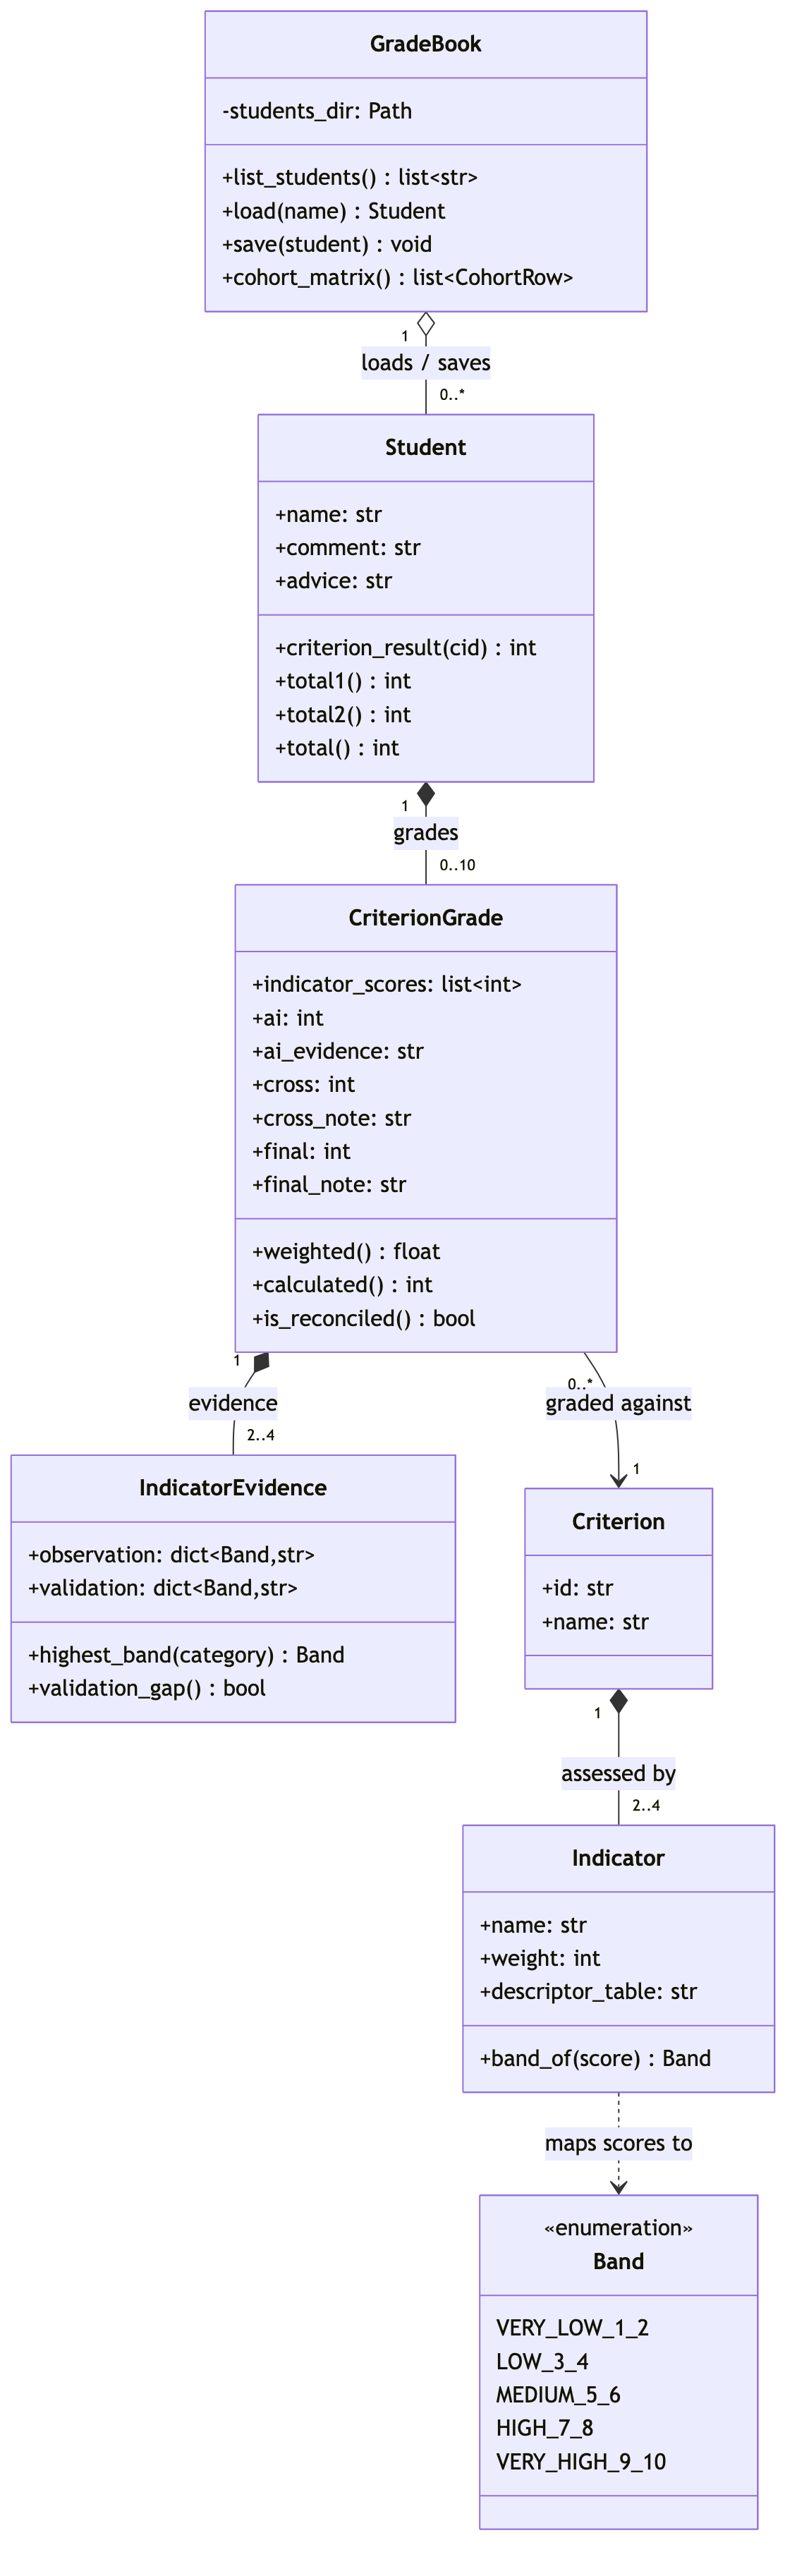
| - | The object descriptions model the **problem domain** — the classes you would design *before* choosing an implementation style. (The real app is built function-over-data, not from these classes; more on that below.) The class diagram, verbatim from the artefact: |
| + | The object descriptions model the **problem domain** — the classes you would design *before* choosing an implementation style. (The real app is built function-over-data, not from these classes; more on that below.) The full class diagram, rendered from the artefact's mermaid source: |
| - | ```mermaid |
| - | classDiagram |
| - | class GradeBook { |
| - | -students_dir: Path |
| - | +list_students() list~str~ |
| - | +load(name) Student |
| - | +save(student) void |
| - | +cohort_matrix() list~CohortRow~ |
| - | } |
| - | |
| - | class Student { |
| - | +name: str |
| - | +comment: str |
| - | +advice: str |
| - | +criterion_result(cid) int |
| - | +total1() int |
| - | +total2() int |
| - | +total() int |
| - | } |
| - | |
| - | class CriterionGrade { |
| - | +indicator_scores: list~int~ |
| - | +ai: int |
| - | +ai_evidence: str |
| - | +cross: int |
| - | +cross_note: str |
| - | +final: int |
| - | +final_note: str |
| - | +weighted() float |
| - | +calculated() int |
| - | +is_reconciled() bool |
| - | } |
| - | |
| - | class IndicatorEvidence { |
| - | +observation: dict~Band,str~ |
| - | +validation: dict~Band,str~ |
| - | +highest_band(category) Band |
| - | +validation_gap() bool |
| - | } |
| - | |
| - | class Criterion { |
| - | +id: str |
| - | +name: str |
| - | } |
| - | |
| - | class Indicator { |
| - | +name: str |
| - | +weight: int |
| - | +descriptor_table: str |
| - | +band_of(score) Band |
| - | } |
| - | |
| - | class Band { |
| - | <<enumeration>> |
| - | VERY_LOW_1_2 |
| - | LOW_3_4 |
| - | MEDIUM_5_6 |
| - | HIGH_7_8 |
| - | VERY_HIGH_9_10 |
| - | } |
| - | |
| - | GradeBook "1" o-- "0..*" Student : loads / saves |
| - | Student "1" *-- "0..10" CriterionGrade : grades |
| - | CriterionGrade "0..*" --> "1" Criterion : graded against |
| - | CriterionGrade "1" *-- "2..4" IndicatorEvidence : evidence |
| - | Criterion "1" *-- "2..4" Indicator : assessed by |
| - | Indicator ..> Band : maps scores to |
| - | ``` |
| + |  |
| Notice the line shapes. Teaching point 1, quoted exactly: | |
| /dev/null .. sd/C05/From SRS to Detailed Designs - Data and Logic/class-diagram-full.png | |
| /dev/null .. sd/C05/From SRS to Detailed Designs - Data and Logic/class-student-criteriongrade.png | |