
From SRS to Detailed Designs — Data and Logic
The Hamilton and Alexandra College · Year 12 · 2026
The Mock-ups sibling of this page traces a screen back to a requirement. This page traces the data and logic the same way, using the same real project — vsd-sat-grader, the SAT folio grader your teacher actually built.
C05-1 asks for four data/logic design tools: a data dictionary, IPO charts, pseudocode, and object descriptions. The trap is to treat them as four separate deliverables you grind out one after another. They are not. They are four views of one design, and the proof is simple: a single sentence from your SRS shows up in all four of them.
Here is that sentence. It is from §7 (Data model) of the real SRS, quoted exactly:
Derived values (bands, calculated scores, totals, ranks) are computed, never stored.
That one rule — store the inputs, compute everything you can derive from them — is the spine of this page. We follow it through all four tools, then through the built UI, and you will see the same idea each time wearing a different costume.
The four tools are one design
The SRS data model is the source. Each design tool is a different lens on it, and each lens also surfaces in the app you can run.
flowchart TD
    SRS["C03 · SRS §7<br/>Data model<br/>'computed, never stored'"]
    SRS --> DD["Data dictionary<br/><i>what is stored vs derived</i>"]
    SRS --> OD["Object descriptions<br/><i>attribute vs method</i>"]
    SRS --> PC["Pseudocode<br/><i>how a value is derived</i>"]
    SRS --> IPO["IPO charts<br/><i>input → process → output</i>"]
    DD --> UI["Built UI"]
    OD --> UI
    PC --> UI
    IPO --> UI
    UI --> SEE["You can see the rule<br/>on screen:<br/>totals, bands, live summary"]
The four tools answer four questions about the same truth — and because the SRS forbids storing derived values, every tool has to agree on which values those are. Disagreement between tools is a design bug. Agreement is traceability.
Fully worked: "computed, never stored", through all four tools
We will now walk the one SRS sentence through every tool, quoting each artefact's own wording so you can see the rule restated in each language.
Tool 1 — Data dictionary: a separate section for what is not stored
Before the big table, meet two complete, small ones. The real data dictionary opens with these — each just two rows, but already carrying the full six-column format (Field / Data type / Format / Description / Example / Validation). The column set itself is the teaching point: every field, however small, gets a type, a format, an example and a validation rule. Both tables verbatim:
1. Criteria (
CRITERIA)
| Field | Data type | Format / range | Description | Example | Validation |
|---|---|---|---|---|---|
cid |
str | C + 2 digits, C01–C10 |
Criterion identifier; also keys the rubric filename | C03 |
Must have a matching data/rubrics/<cid>-rubric.md |
name |
str | ≤ 80 chars | Criterion title from the VCAA rubric heading | Skills in documenting a software requirements specification |
Non-empty |
2. Band scale (
BANDS,BAND_LABELS)
| Field | Data type | Format / range | Description | Example | Validation |
|---|---|---|---|---|---|
band |
str | low-high, 5 fixed values |
Rubric band a score falls in: 1-2, 3-4, 5-6, 7-8, 9-10 |
7-8 |
One of the 5 values |
band_label |
str | band + qualifier | Display label for evidence grids | 7-8 (high) |
Derived 1:1 from band |
Four rows do not look like much — until you see how much of the screen they drive. Here is the Grade tab; look at the labels:
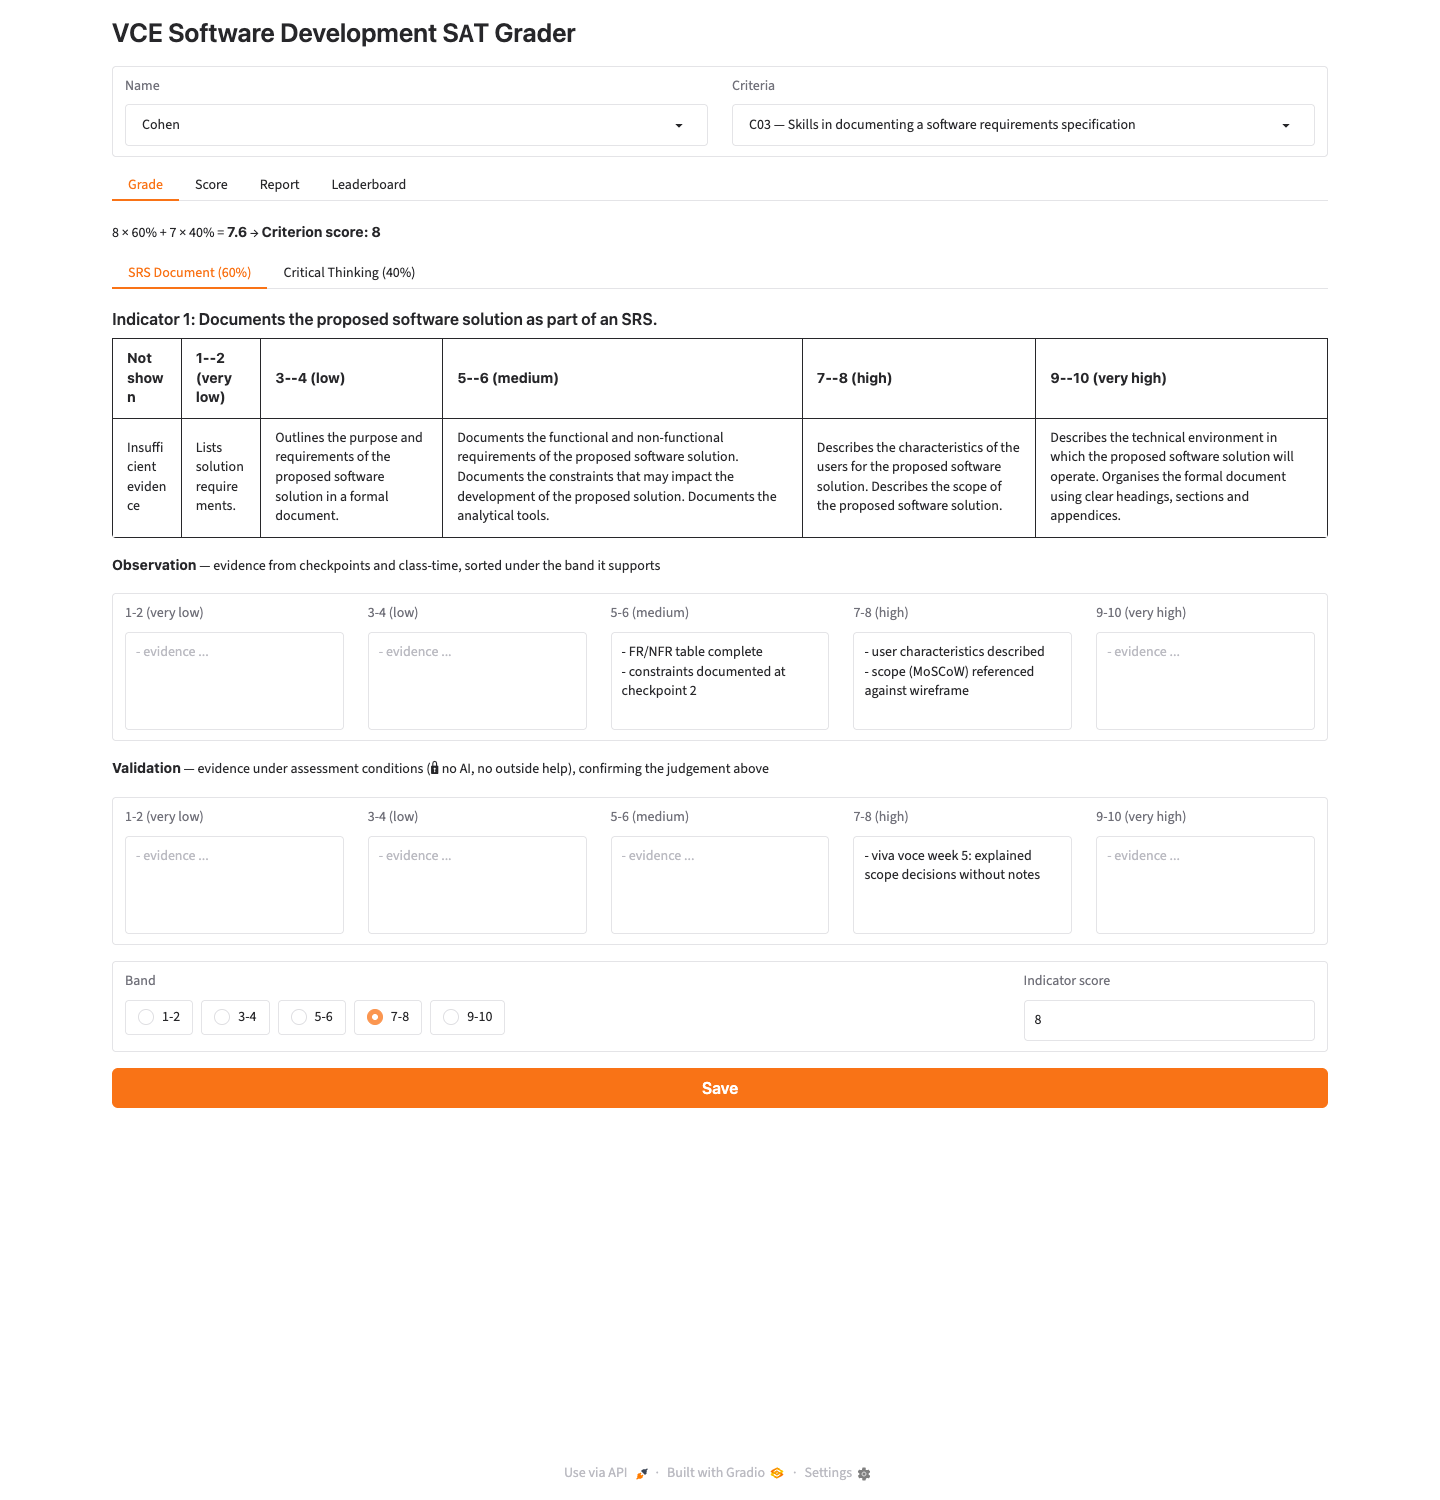
The five Band radio buttons (1-2 … 9-10) are exactly the five fixed values of band — "One of the 5 values", nothing else can exist. And the column headers across both evidence grids — "1-2 (very low)" … "9-10 (very high)" — are band_label, the "band + qualifier" display form, "Derived 1:1 from band". Two tiny tables, and every band label on the screen is accounted for: the cid in the Criteria dropdown comes from the first, every band marking on the page comes from the second.
That is a complete data dictionary in miniature — you can read it end to end in thirty seconds. Now you are ready for the real thing: §4, the student record, the shape that becomes one markdown file per student in Sprint 2. Here is an abbreviated cut — four rows chosen to show the variety the format can carry, each verbatim:
4. Student record (
MOCK_STUDENTS→ one markdown file per student in Sprint 2)
| Field | Data type | Format / range | Description | Example | Validation |
|---|---|---|---|---|---|
student |
str | ≤ 50 chars | Student name; keys the record and the leaderboard | Cohen |
Unique within cohort; non-empty |
grades |
dict | keyed by cid |
Grading record per criterion (absent = not graded yet) | {"C03": {...}} |
Keys ∈ CRITERIA |
grades[cid].indicator_scores |
list[int | None] | 0–10 whole numbers, one per indicator | Teacher's score per indicator | [8, 7] |
Length ≤ indicator count; each 0–10 or empty |
grades[cid].final |
int | None | 0–10 | Final criterion score after the teacher reconciles calculated vs AI vs cross-marker; never auto-filled | 8 |
0–10 or absent |
… plus 10 more fields (evidence grids, AI score and evidence, cross-mark, reconciliation note, report comment and advice) — read the full table on GitHub.
Notice the variety those four rows carry: a simple string with a uniqueness rule (student), a dict keyed by criterion (grades), a list validated per item (indicator_scores), and a nullable int whose description states a policy — final is "never auto-filled". Same six columns every time.
So §§1–4 document everything stored. The punchline is what comes next: a separate §5 for derived values — the things the dictionary deliberately does not let you store. The heading is exact:
5. Derived values (computed, never stored)
A few of its rows:
| Value | Derivation | Example |
|---|---|---|
| Total 1 | Sum of criterion results for C01–C05 (Unit 3 Outcome 2) | 15 |
| Total 2 | Sum of criterion results for C06–C10 (Unit 4 Outcome 1) | 0 |
| Rank | Cohort summary row order: sorted by Total, descending | top row |
Now look at the built Leaderboard. Those rows are not abstractions — they are columns on screen:
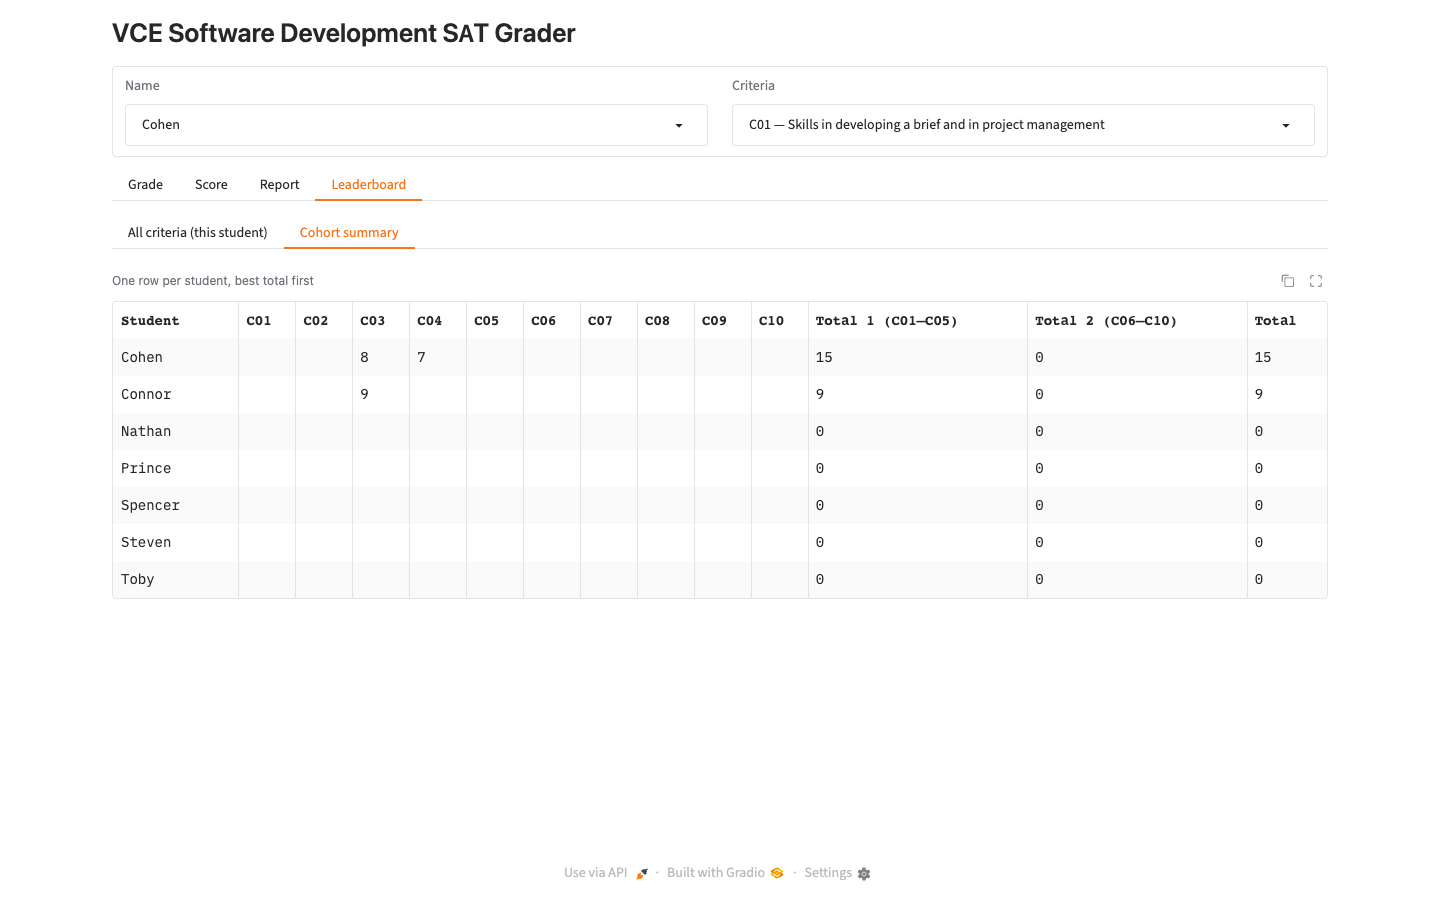
The column headers Total 1 (C01–C05), Total 2 (C06–C10) and Total are the three data-dictionary rows above, made visible. And the row order is the derived "Rank": Cohen (Total 15) sits above Connor (Total 9) because the table is "sorted by Total, descending" — the app never stores a rank number, it sorts and the position is the rank.
The scores here are Sprint 1 mock data, not real grades. Cohen's C03 indicators are [8, 7] — the exact example student record shown in the SRS §7 code block. That is why the same numbers reappear throughout this page: they are the SRS's own worked example travelling from artefact to artefact.
Tool 2 — Object descriptions: stored is an attribute, derived is a method
The object descriptions say the same thing in object-oriented language. Teaching point 3, quoted exactly:
Stored vs derived, as attribute vs method —
finalis an attribute (a teacher's decision, stored);calculated()is a method (a weighted average, derived). This is the class-diagram form of our data rule "derived values are never stored".
So the data dictionary's "stored vs derived" split is the object model's "attribute vs method" split. final carries () nowhere — it is a value you keep. calculated() carries () — it is a value you compute on demand and throw away.
Tool 3 — Pseudocode: how the derived value is actually computed
The data dictionary says a calculated score is derived. The object model says calculated() is a method. The pseudocode says how. Algorithm 1 derives it, hop by hop, for Cohen's C03 ([8, 7], weights [60, 40]):
- For each scored indicator, add
indicatorScore × weighttototalWeightedandweighttototalWeight:8 × 60 = 480,7 × 40 = 280, sototalWeighted = 760,totalWeight = 100. weighted ← totalWeighted / totalWeight→760 / 100 = 7.6.RETURN RoundHalfUp(weighted)→7.6 → 8.
Nothing in that algorithm reads a stored score. It reads the inputs (indicator scores, weights) and derives the result fresh every time — exactly what "computed, never stored" demands.
Tool 4 — IPO charts: it can recompute live because nothing is stored
The IPO charts have an event row that only makes sense if derived values are never stored. Quoted exactly from the event-level table:
live_summary— Recompute the criterion score as indicator scores are typed.
And a sibling row:
band_of— Which rubric band a score falls in.
If the calculated score were stored, you would have to save it before it could update. Because it is derived, the app can recompute it on every keystroke. Here is the Grade tab where both rows fire:
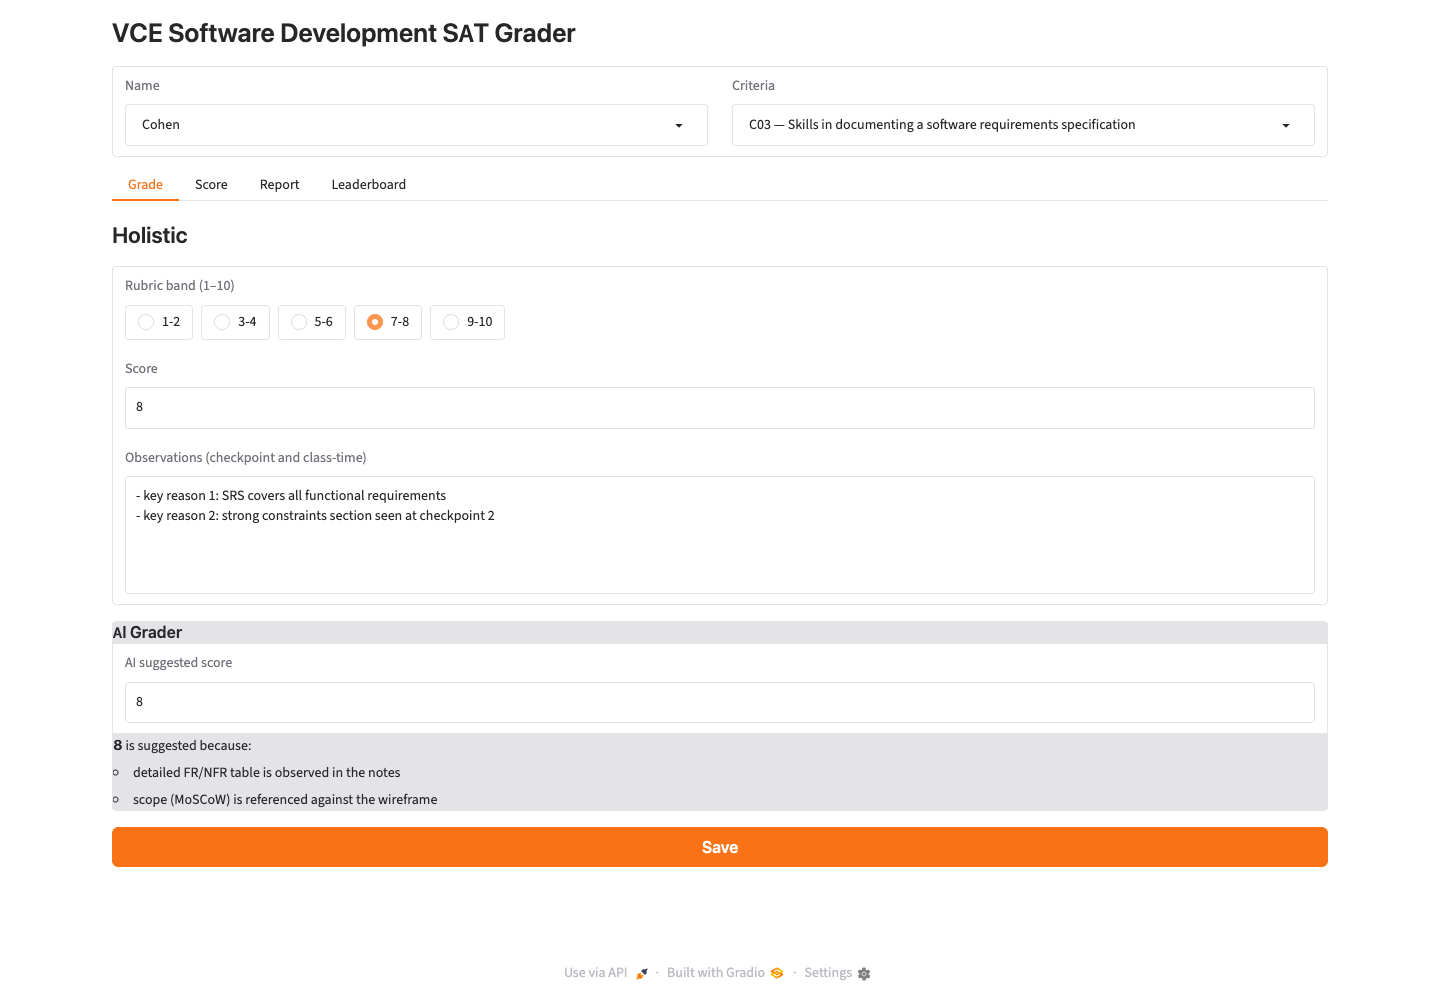
The 7-8 band is highlighted in orange because band_of(8) returns the 7-8 band — that highlight is the band_of IPO output rendered on screen. As you type a score, live_summary re-derives the criterion score behind the Score tab. Neither value is written to disk until you Save; both are derived live. That is the IPO chart's restatement of the same one rule.
Four tools, four costumes, one sentence. That is what "four views of one design" means.
Each tool, anchored to a requirement (your turn to finish each)
Above, the guidance was full. Below, it fades: each tool gets a short section that names which requirement it answers, then ends with one question for you to take into your design log.
Data dictionary ← FR2 + SRS §7
FR2 quoted exactly:
All data is persisted as markdown files (one file per student) — the single source of truth, editable by hand or by AI tools.
"One file per student" is why the data dictionary's §4 documents a single student record shape (student, grades, comment, advice) rather than a database schema. SRS §7 shows that record as YAML frontmatter; the data dictionary gives each field a type, format, example and validation rule. The frontmatter shape is the data dictionary, written out as a file.
Your design log: find one field in data-dictionary §4 whose Validation column would be impossible to enforce if data lived in a database instead of one markdown file per student. (Hint: look at
student— "Unique within cohort".)
IPO charts ← the context diagram
You met context diagrams back in C02 — one process, the external entities around it, the data flowing in and out. The IPO charts pick up exactly there. The system-level IPO row is built straight from the context diagram:
| Input | Process | Output |
|---|---|---|
| Indicator scores + evidence, cross-mark + note, final score + note, report comments (Teacher 1); AI suggested score + evidence (Claude Code, via markdown) | Grade each criterion per indicator; weight indicator scores into calculated criterion scores; support reconciliation; aggregate cohort totals | Rubric descriptors, calculated scores with working, reconcile view, cohort summary (Teacher 1); evidence + rubric + scores as markdown (to Claude Code); final scores + report (to School Report System) |
The external entities from the context diagram (Teacher 1, Claude Code, the School Report System) reappear here as the sources of inputs and the destinations of outputs.
The event-level IPO charts are generated from the app's own event wiring, so design and build cannot drift apart. The artefact says so: every Gradio handler is trigger.change(process, [inputs], [outputs]), so the charts are produced by tools/generate_ipo.py and you "regenerate after any wiring change with uv run python tools/generate_ipo.py". Change the build, regenerate, the design updates — they are never out of sync.
Here is one clean event row — band_of, the band highlight you saw on the Grade tab:
| Event (trigger) | Input | Process | Output |
|---|---|---|---|
| Indicator score → change ×4 | Indicator score | band_of — Which rubric band a score falls in. |
Band |
The big refresh row — the one fired by changing student or criterion — has an Output column listing every component on every tab (Grade 1, Grade 2, … Cohort summary). It is auto-generated and gloriously long, so it is not reproduced here. Read it in the full ipo-charts.md on GitHub; its length is a feature, not a flaw — it is the machine listing every output one reload must refresh.
Your design log: the
refreshrow has a huge Output column but a tiny Input column (just Name, Criteria). Why does one small input produce so many outputs? (What does "reload every tab" have to do with NFR1, "fresh reads, no caches"?)
Pseudocode ← FR5 + corrections 06/07
FR5 quoted exactly:
The app displays an AI-suggested score + evidence when present in the markdown (produced externally — see §6). The app is read-only toward these fields.
The app shows the AI score; it never trusts it blindly. Deciding the final score is a human job, and the pseudocode has two algorithms precisely to make that split explicit. Algorithm 1 (above) is automated. Algorithm 2 is a teacher procedure the app deliberately never automates. Design note 1, quoted exactly:
The final score is never computed — Algorithm 2 contains teacher decisions ("teacher's choice", "teacher's judgement") by design. The app automates the references, not the judgement.
The reconcile view is Algorithm 2 on screen:
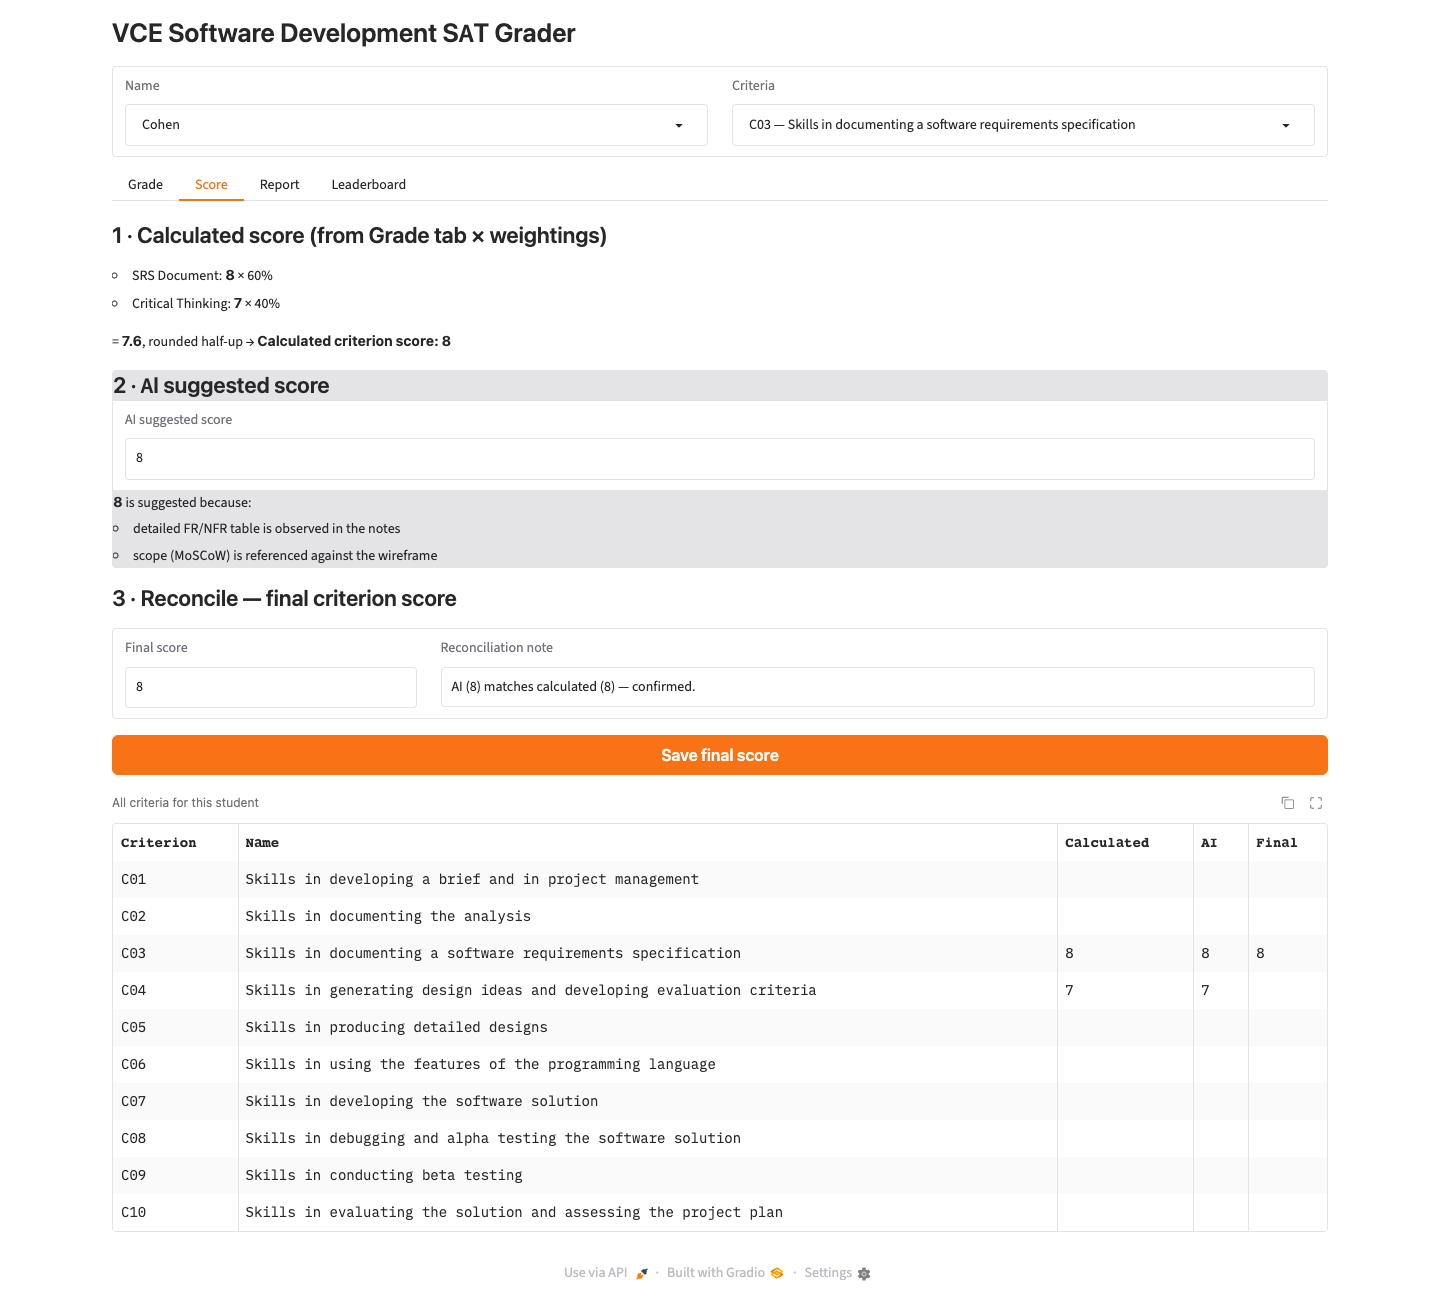
Three reference scores are shown side by side — Calculated (8), AI (8), and a place for the cross-mark — and the teacher types the Final and a note. The app presents; the human decides. Algorithm 2's decision structure, quoted from the pseudocode:
    IF references = {calculated} THEN         // no second opinion available
        final ← calculated
    ELSE IF Max(references) − Min(references) = 0 THEN
        final ← calculated                    // unanimous
    ELSE IF Max(references) − Min(references) ≤ 1 THEN
        final ← teacher's choice IN [Min(references), Max(references)]
    ELSE
        // Major disagreement (gap ≥ 2): do not split the difference.
        final ← teacher's judgement after review
    END IF
On screen, Calculated 8 and AI 8 agree — the Max − Min = 0 branch — so the note reads "AI (8) matches calculated (8) — confirmed."
Your design log: the last branch forbids "split the difference" when references disagree by 2 or more. Quote design note 3 and explain what a gap of 2 is taken to mean about the evidence.
Object descriptions ← the problem domain
The object descriptions model the problem domain — the classes you would design before choosing an implementation style. (The real app is built function-over-data, not from these classes; more on that below.) The class diagram, verbatim from the artefact:
classDiagram
    class GradeBook {
        -students_dir: Path
        +list_students() list~str~
        +load(name) Student
        +save(student) void
        +cohort_matrix() list~CohortRow~
    }

    class Student {
        +name: str
        +comment: str
        +advice: str
        +criterion_result(cid) int
        +total1() int
        +total2() int
        +total() int
    }

    class CriterionGrade {
        +indicator_scores: list~int~
        +ai: int
        +ai_evidence: str
        +cross: int
        +cross_note: str
        +final: int
        +final_note: str
        +weighted() float
        +calculated() int
        +is_reconciled() bool
    }

    class IndicatorEvidence {
        +observation: dict~Band,str~
        +validation: dict~Band,str~
        +highest_band(category) Band
        +validation_gap() bool
    }

    class Criterion {
        +id: str
        +name: str
    }

    class Indicator {
        +name: str
        +weight: int
        +descriptor_table: str
        +band_of(score) Band
    }

    class Band {
        <<enumeration>>
        VERY_LOW_1_2
        LOW_3_4
        MEDIUM_5_6
        HIGH_7_8
        VERY_HIGH_9_10
    }

    GradeBook "1" o-- "0..*" Student : loads / saves
    Student "1" *-- "0..10" CriterionGrade : grades
    CriterionGrade "0..*" --> "1" Criterion : graded against
    CriterionGrade "1" *-- "2..4" IndicatorEvidence : evidence
    Criterion "1" *-- "2..4" Indicator : assessed by
    Indicator ..> Band : maps scores to
Notice the line shapes. Teaching point 1, quoted exactly:
Composition vs association — a
Studentowns theirCriterionGrades (delete the student, the grades go too: filled diamond), but a grade merely refers to itsCriterion— the rubric exists independently and is shared by every student (arrow, not diamond).
So Student *-- CriterionGrade is a filled diamond (composition: the grades belong to that student and die with them), while CriterionGrade --> Criterion is a plain arrow (association: the rubric is shared, not owned). The diamond is not decoration — it encodes who owns what.
Class discussion — the app's author chose to not build these classes, using dicts and pure functions instead. From the artefact:
the implementation chose dicts + pure functions over these classes. What did that trade away (encapsulation, invariants living next to the data) and what did it buy (markdown round-tripping is trivial, functions are easy to unit test, no object/file mapping layer)? Both are valid detailed designs; the object description is how you communicate the domain either way.
Your turn — trace validation_gap through three tools
You have seen "computed, never stored" appear in four tools. Now trace a different idea yourself. The anti-AI-cheating check — the standard observed in class was not reproduced under assessment conditions — lives, like that sentence, in three artefacts at once:
- Pseudocode, as the guard at the top of Algorithm 2: a
FOR EACH indicatorloop that flagsREVIEWwhenHighestBand(indicator.validation) < HighestBand(indicator.observation)— in pseudocode-final-score.md. - Object descriptions, as the method
validation_gap()onIndicatorEvidence— in object-descriptions.md. - Data dictionary, as the two evidence fields it compares:
…evidence[i].observationand…evidence[i].validation— in data-dictionary.md.
Open all three and answer in your design log:
- The pseudocode guard and the
validation_gap()method describe the same comparison. Quote the condition from each and show they are the same test written two ways. - The data dictionary says
validationis "Evidence under assessment conditions (no AI / outside help); confirms the judgement." Why does a lower validation band than observation band suggest a problem worth reviewing? - Is
validation_gapa stored value or a derived one? Which tool would you cite to justify your answer, and how does that connect back to "computed, never stored"?
The real files
Open these on GitHub and read the originals. Each is the artefact a section above quotes.
| Artefact | Link |
|---|---|
| SRS (FR/NFR tables, §7 data model, MoSCoW scope) | SRS/SRS.md |
| Data dictionary (stored §4, derived §5) | C05/data-dictionary.md |
| IPO charts (system-level + generated event rows) | C05/ipo-charts.md |
| Pseudocode (Algorithm 1 automated, Algorithm 2 teacher procedure) | C05/pseudocode-final-score.md |
| Object descriptions (class diagram + teaching points) | C05/object-descriptions.md |
The SD26-Students repository is private. To open these links you must be signed in to GitHub with your class account. If you get a 404, you are not signed in — log in and try again.
Check Your Understanding
- One SRS sentence appears in all four design tools. Quote it, then name the form it takes in each tool: the data dictionary, the object descriptions, the pseudocode, and the IPO charts.
...
The sentence is SRS §7: "Derived values (bands, calculated scores, totals, ranks) are computed, never stored." In the data dictionary it is a separate §5 "Derived values (computed, never stored)" table. In the object descriptions it is the attribute-vs-method split — final is a stored attribute, calculated() is a derived method. In the pseudocode it is Algorithm 1, which derives the calculated score from inputs every time. In the IPO charts it is the live_summary / band_of rows that recompute on every keystroke — only possible because the values are never stored.
- Why is
finalan attribute butcalculated()a method?
...
final is the teacher's reconciled decision — a value you store, because it cannot be re-derived from anything (it is a judgement). calculated() is a weighted average of the indicator scores — a value you derive on demand from inputs that already exist, so storing it would break "computed, never stored". Attribute = stored input; method = derived output.
- Algorithm 2 contains the words "teacher's judgement" instead of a formula. Why is that a deliberate design decision, not a missing piece of the algorithm?
...
Design note 1 says so: "The final score is never computed … the app automates the references, not the judgement." FR5 makes the app read-only toward the AI score, and reconciling calculated vs AI vs cross-mark is a moderation decision a human must own. Replacing the judgement with a formula (e.g. averaging) would make the app decide grades — and design note 3 explicitly forbids averaging across a disagreement of 2 or more, because a large gap signals mis-banded evidence to re-examine, not a number to split.
- What makes the IPO charts unable to drift apart from the build?
...
They are generated from the app's own event wiring by tools/generate_ipo.py — each chart is read straight out of the Gradio trigger.change(process, [inputs], [outputs]) handlers. The build is the source of the chart, so you regenerate after any wiring change (uv run python tools/generate_ipo.py) and the design updates with it. A hand-written chart can fall out of date; a generated one cannot.
See also
- From SRS to Detailed Designs — Mock-ups — the sibling page: traces a screen (FR3, FR9, FR6) from SRS → wireframe → build → correction, where this page traces the data and logic.
- Data Dictionary — teaches the data-dictionary tool in general (headings, why "format" is not "type"); this page shows it working with the other three on a real project.
- IPO Charts - Process Means Steps — teaches the IPO tool in general (Process = numbered steps); this page shows a generated IPO chart in context.
- VCAA Pseudocode Not Python — teaches language-independent pseudocode in general; this page shows two real algorithms doing the work.
- Object Descriptions and Class Diagrams — teaches the object-description tool in general (attributes, methods, reading a class diagram); this page shows a real class diagram tied to the data rule.
← Back to C05 Home · VCE Software Development Hub